Overview Page Description
Open the overview page
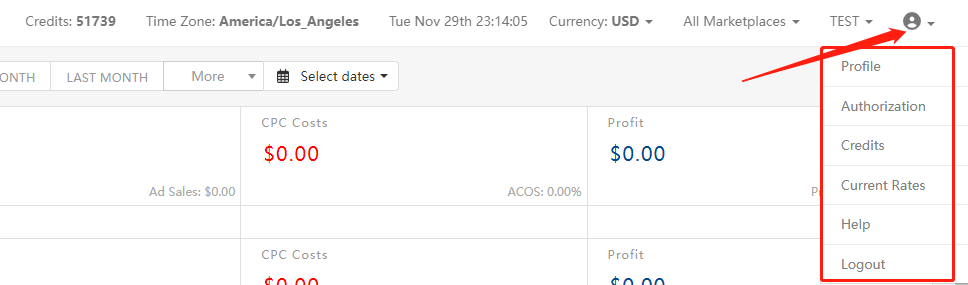
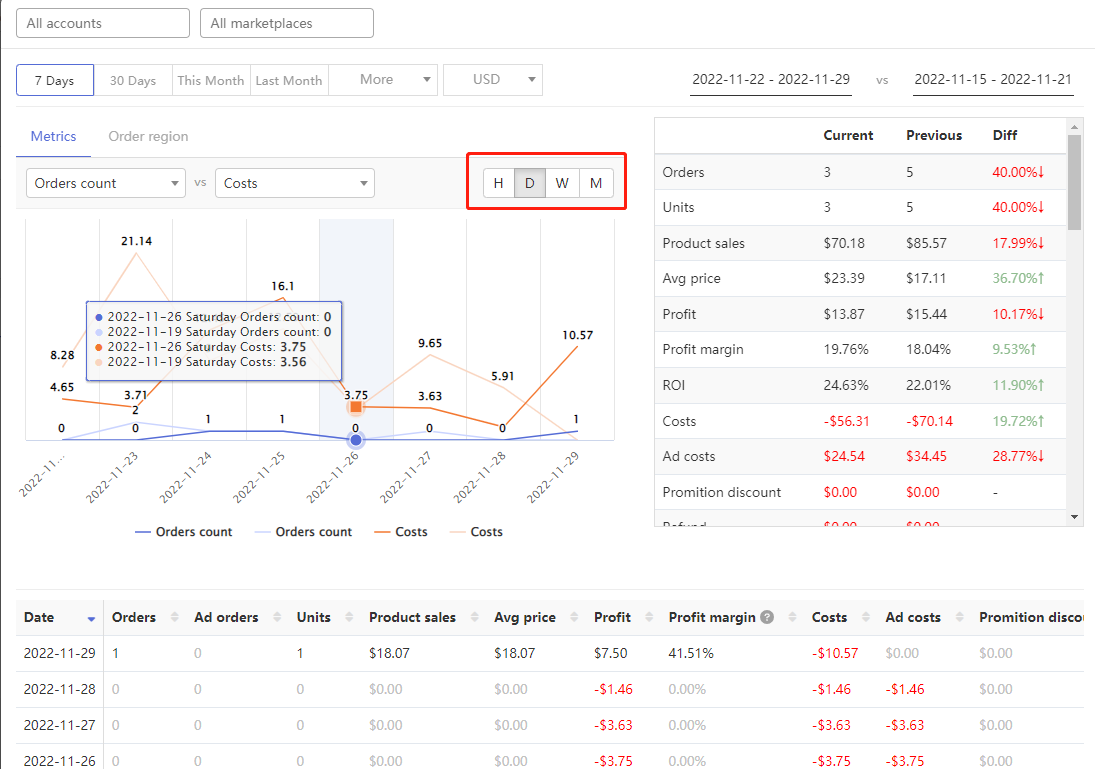
You can view the Credits, Time, Currency and Store Marketplace
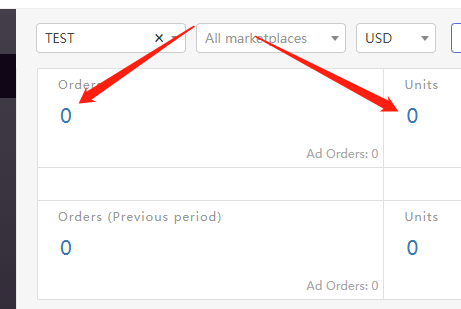
The upper and lower columns represent the sales data of the current time period
and the data of the previous time period respectively
Click the pie chart of profit in the upper right corner to view the Profit Cost Breakdown
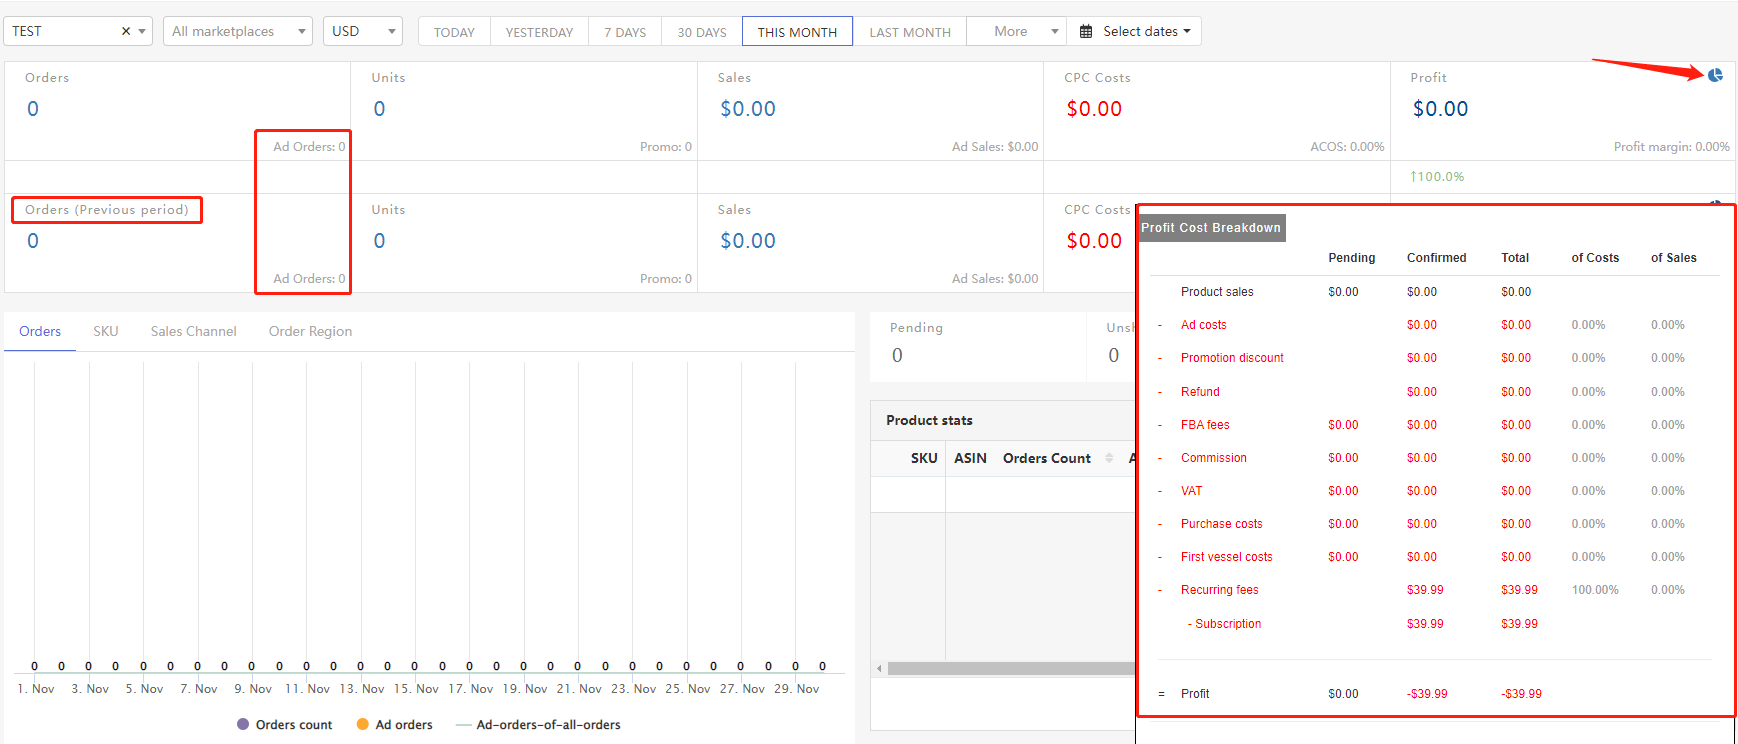
Click the sales data to pop up the details page
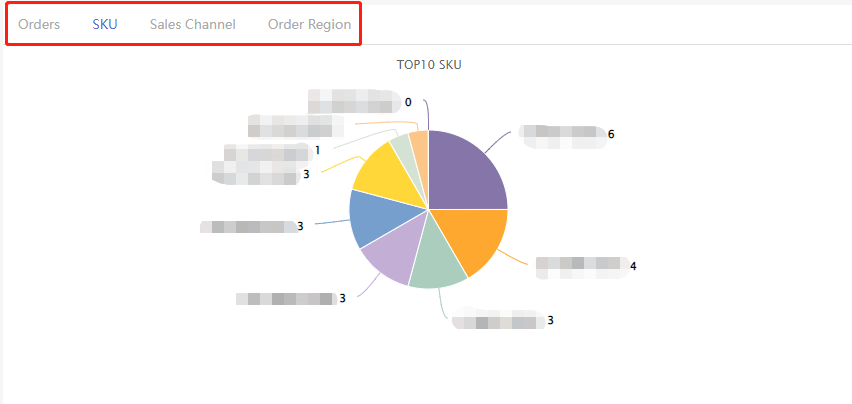
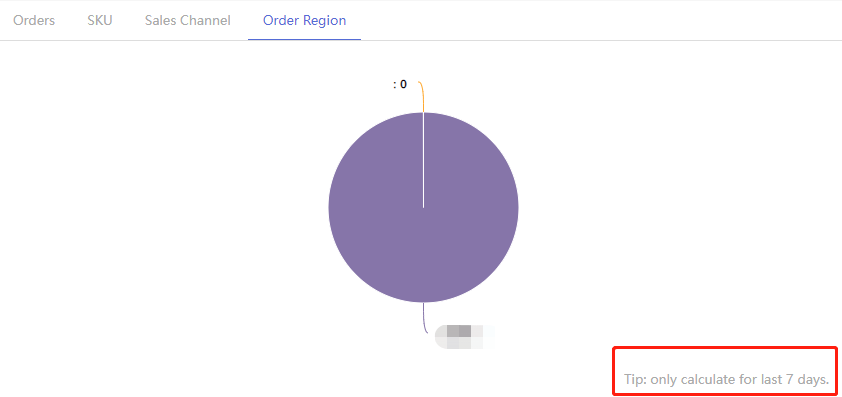
In the second part, you can see the summary and histogram of the current sales data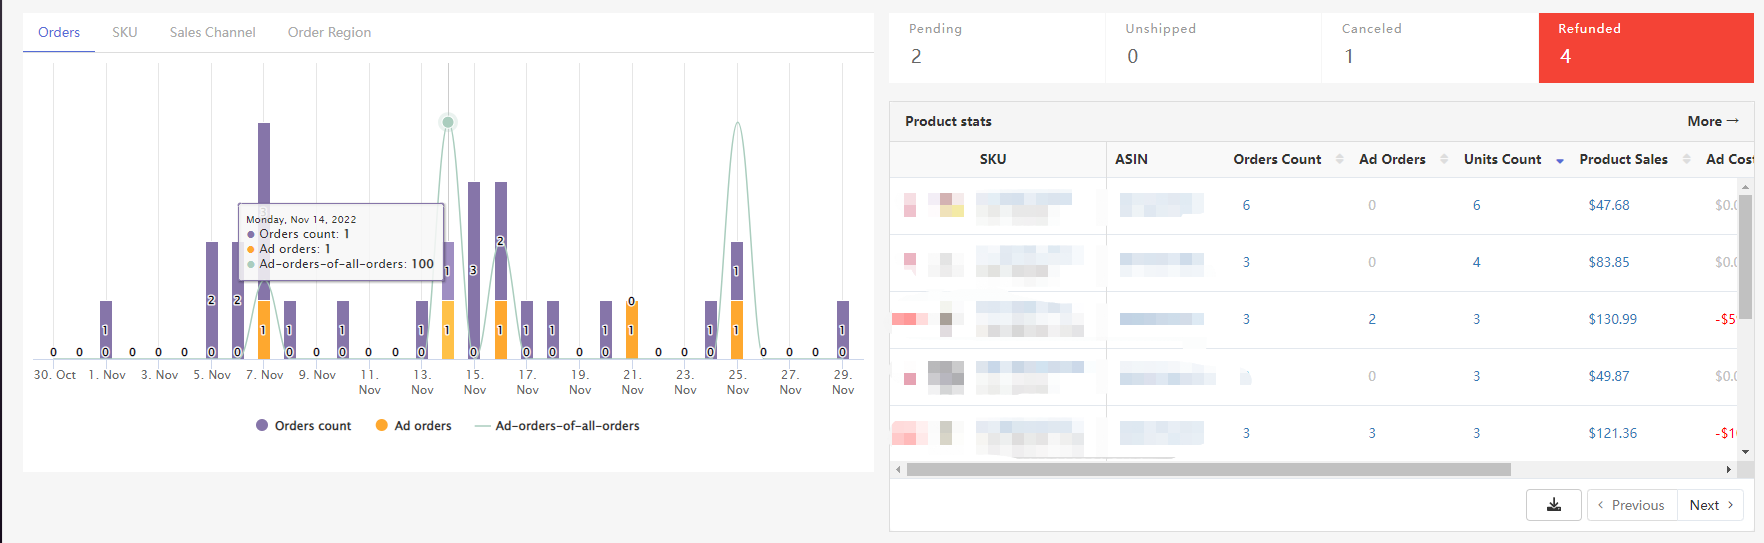
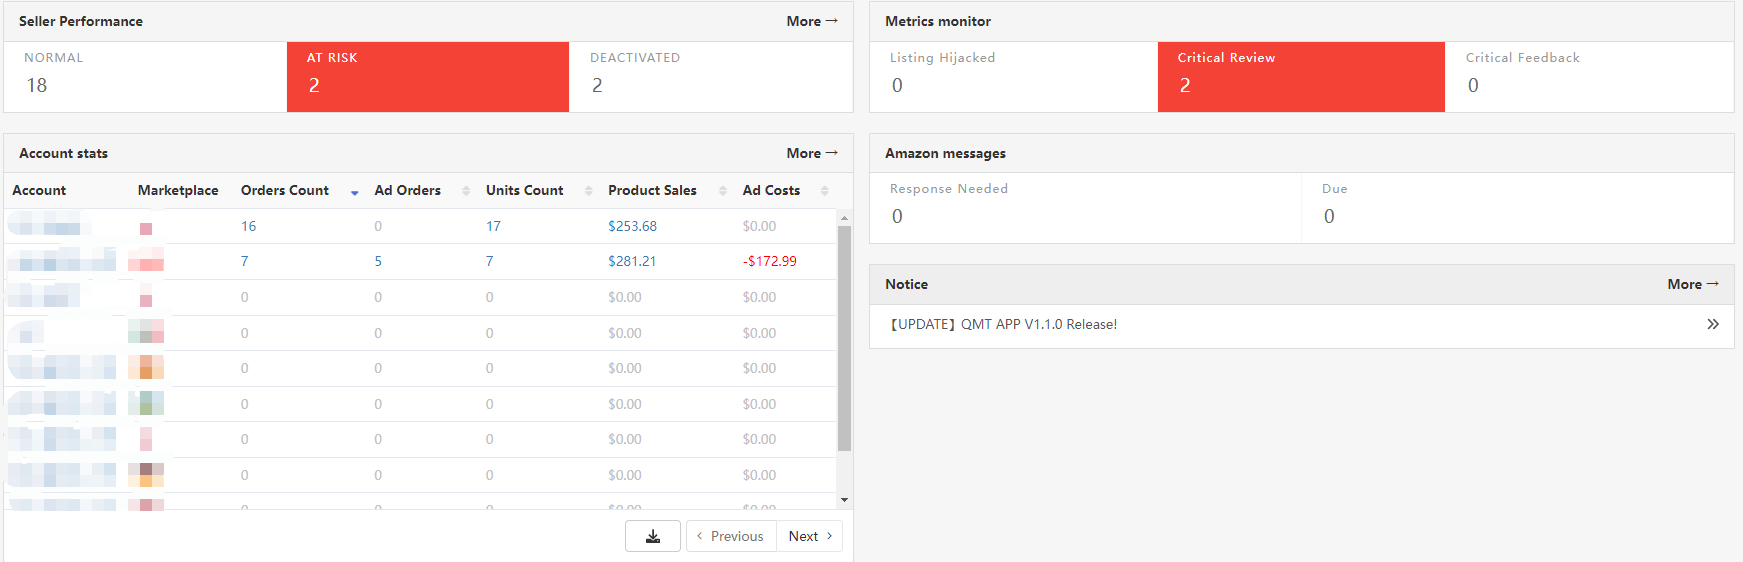
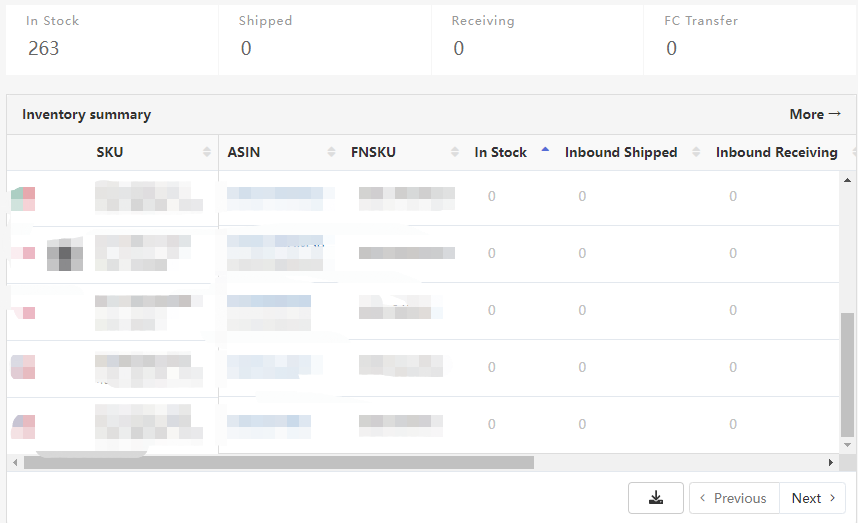
In this section, you can simply view the inventory of the top ten products, and click to jump to the inventory details
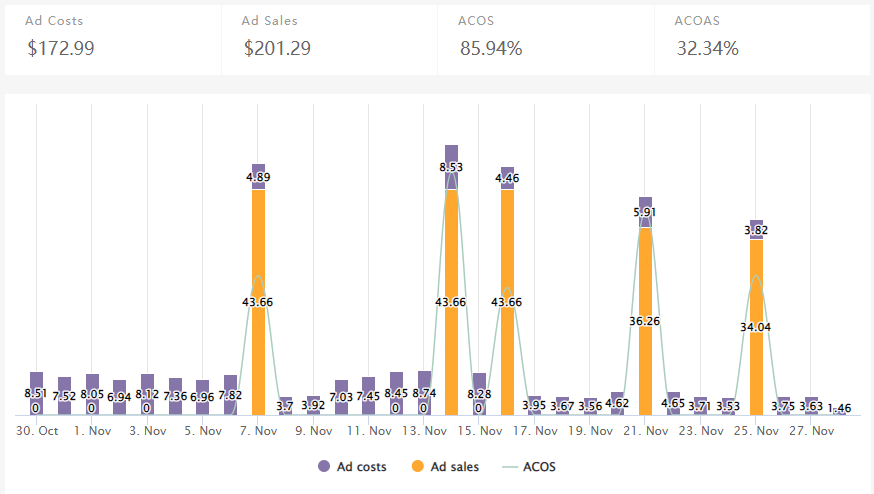
Advertising overview
At the bottom, you can see the monitoring information and store overview